Most merchants already have a size chart. It is sitting in a supplier PDF, a screenshot from an old app, or a flat image buried in a product description that no one scrolls to. The problem was never finding the numbers — it was turning them into something clear, branded, and easy to update.
Rebuilding a chart by hand is slow: retype every row, line up the columns, fight with table styling, then do it again for the next product. So most stores never get past the static image.
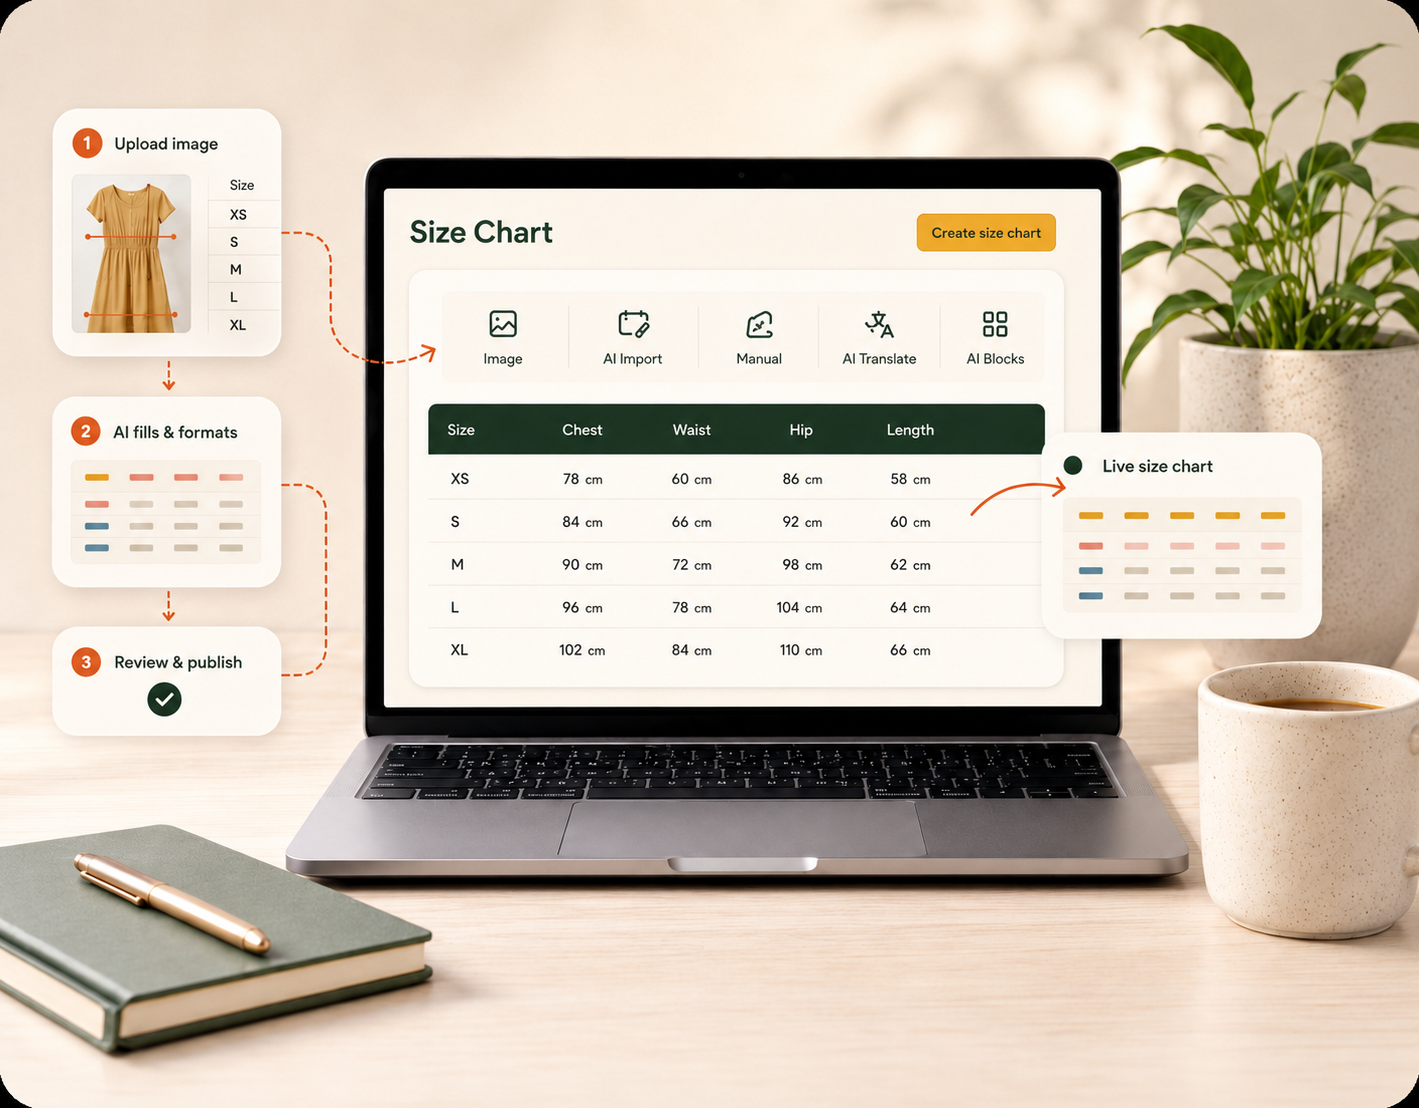
With SmartSize you skip all of that. Here is the whole flow — from an existing chart to a live, linked size chart on your product page — in four steps.
Step 1 — Take a screenshot of your existing chart
Start with whatever you already have. Open your supplier’s size chart, your old image-based guide, or the chart from your previous app, and take a plain screenshot. A photo or a PDF works too.
You do not need to clean it up, crop it perfectly, or rebuild the table first. SmartSize’s AI is reading the structure — the sizes and measurements — so a normal screenshot is enough.
Step 2 — Upload it with AI
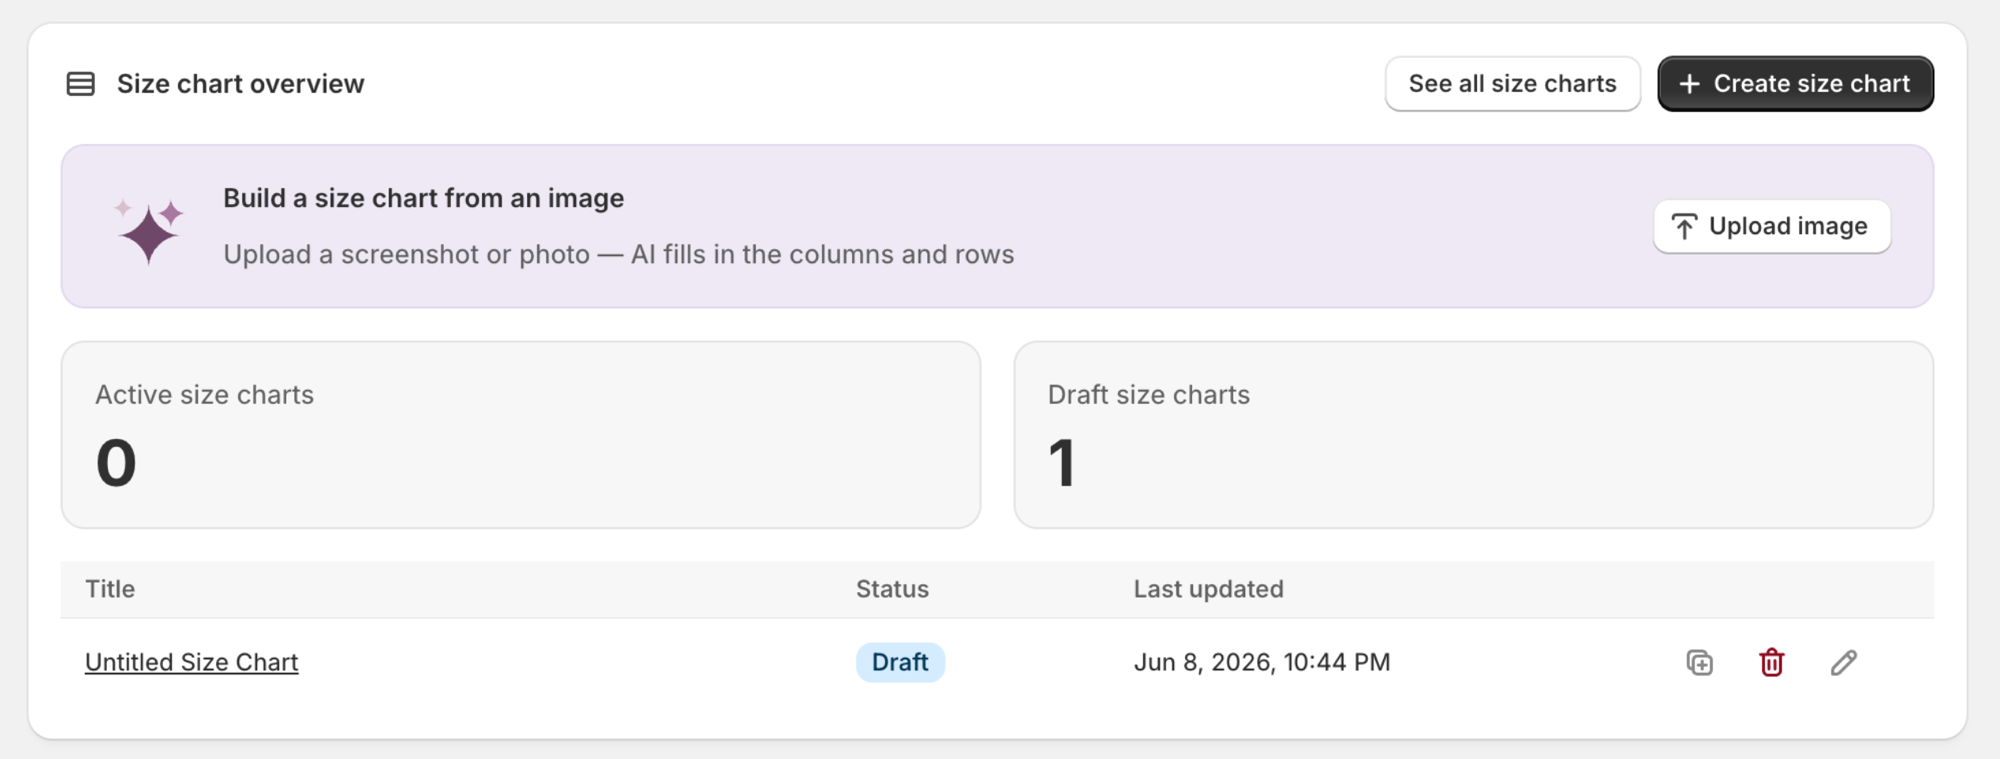
Inside SmartSize, drop the screenshot into the Build a size chart from an image panel and hit upload. SmartSize’s AI reads the table, extracts every row and column, and rebuilds it as a structured, editable table — no retyping, no spreadsheets.
A few seconds later you have a real SmartSize table, not a flat image. Every value is editable, every column can be converted between units, and the whole thing can be translated later. This is the fastest way to move off static size information — a supplier PDF or an old screenshot becomes live content almost instantly.
Step 3 — Add any components you want
A great size chart is more than a grid of numbers. Once your table is in, the modular editor lets you add anything else a shopper needs to feel sure about their size.
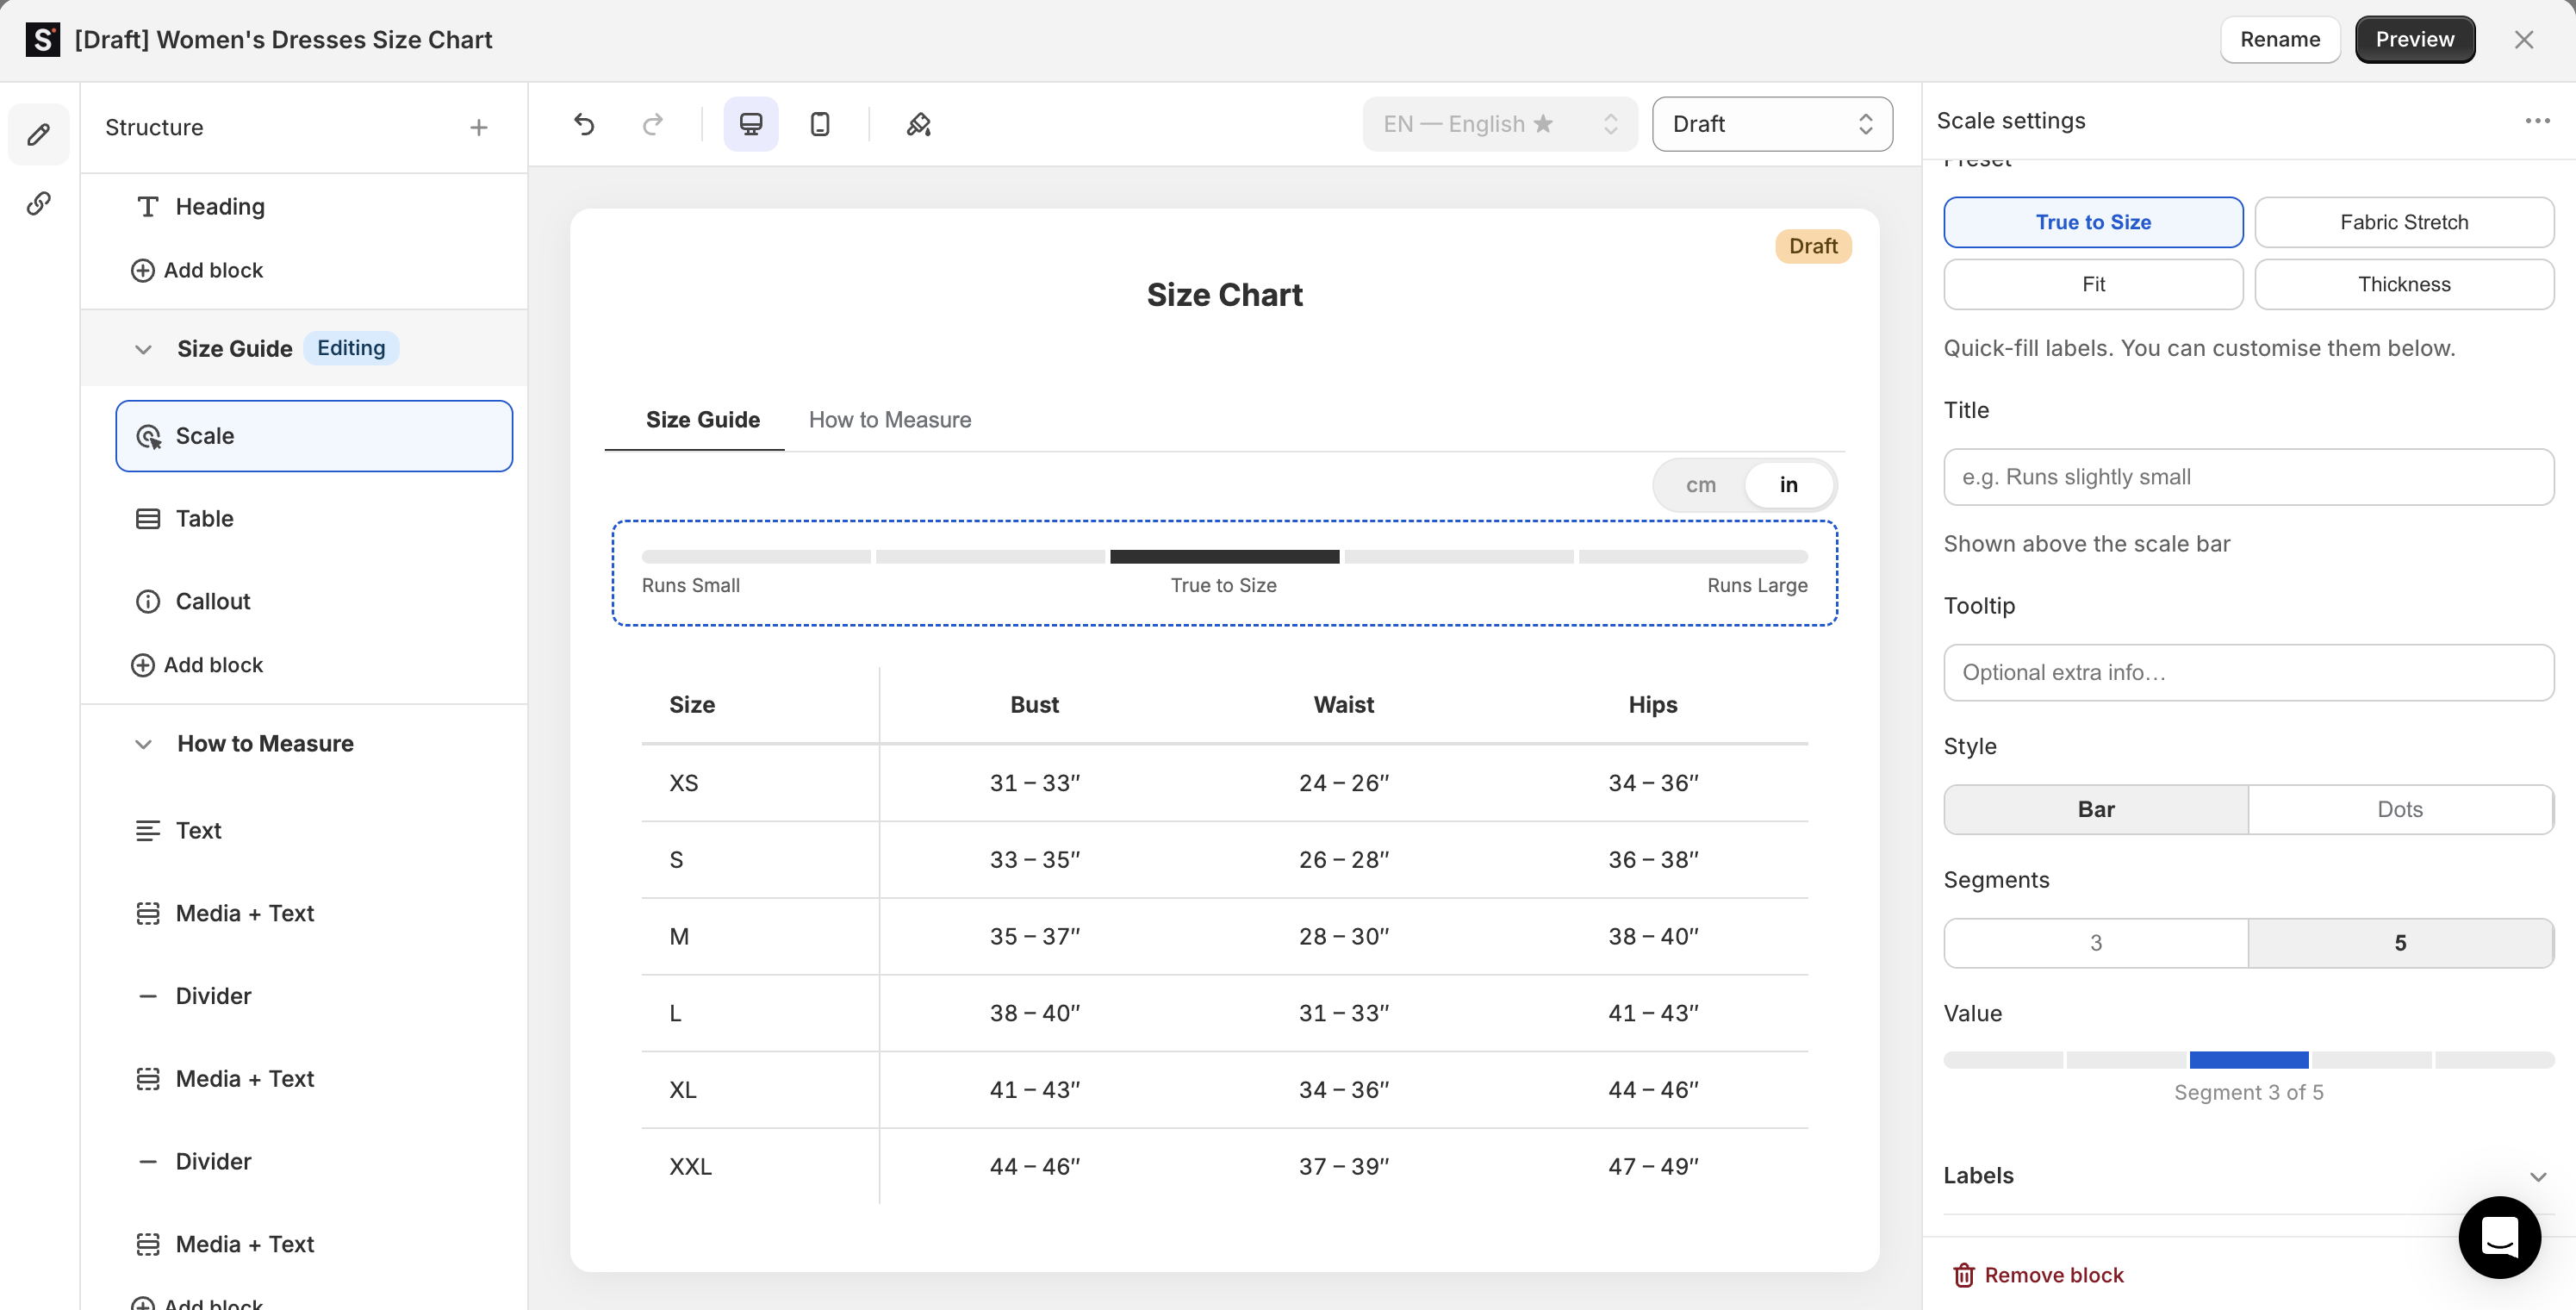
The editor works like the Shopify theme editor: a Structure panel of draggable blocks on the left, a live preview in the center, and per-block settings on the right. Drop in the blocks that fit your product:
- How-to-measure diagrams so shoppers know exactly where to put the tape.
- Fit scales like Runs Small → True to Size → Runs Large.
- Callouts for the things that drive returns — “Runs small — size up if you’re between sizes.”
- International sizes mapping US / EU / UK / JP, plus automatic cm ↔ in and kg ↔ lbs conversion.
- Text, images, dividers, and video for material notes or measurement tutorials.
Everything updates in the live preview as you go, and you can save your styling as a reusable preset so the next chart matches your brand in one click.
Step 4 — Link it to a product
A finished chart only helps if it shows up in the right place. SmartSize’s product display rules decide exactly where each chart appears — assign it by product, collection, product type, vendor, or tag, in any combination.
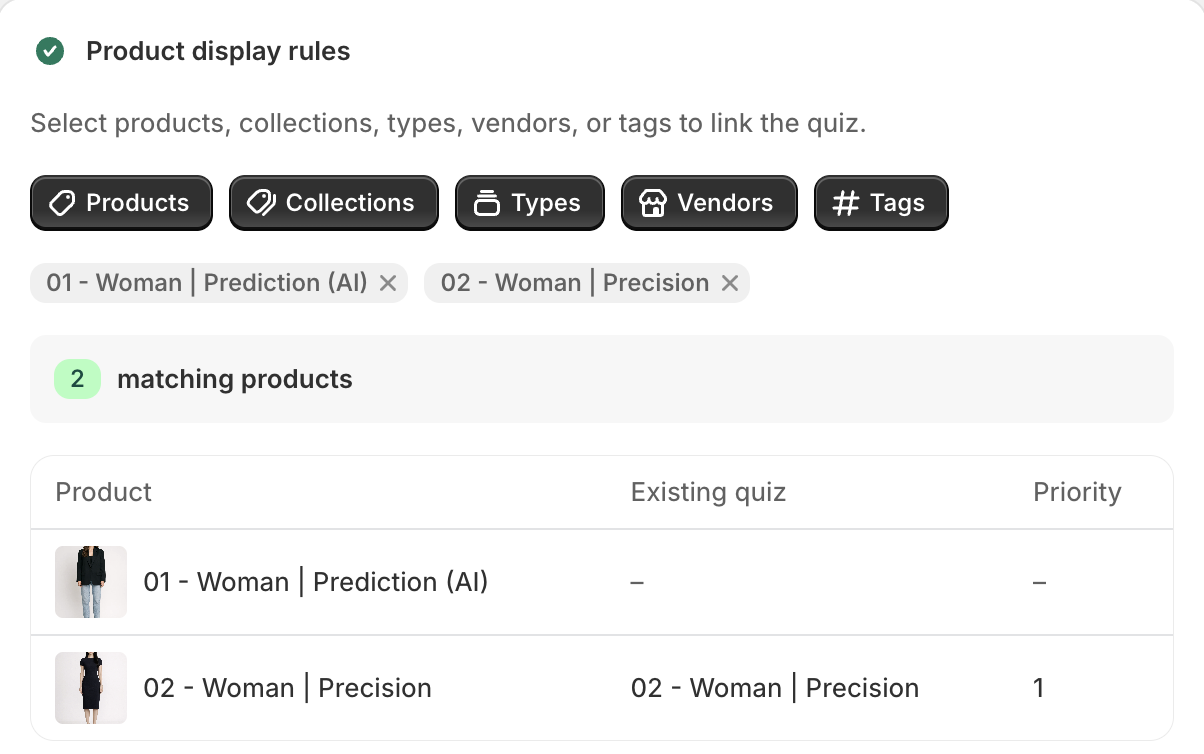
As you add filters, SmartSize shows a live matching products count and a preview table, so you can see exactly which products are covered before you publish — no guesswork, no products left without a chart. Then place the Size Chart button through Shopify’s native theme editor, and you’re live.
→ See a finished SmartSize chart live on our demo store
From screenshot to live chart, start to finish
That’s the whole loop:
- Screenshot your existing chart.
- Upload it and let AI rebuild it as an editable table.
- Add the blocks that answer “what size should I buy?”
- Link it to the right products and publish.
No theme code, no retyping, no rebuilding the same chart twice. The chart you’ve been meaning to clean up for months becomes a clear, branded, mobile-friendly size guide in the time it takes to find the original file.
Want to see everything the builder can do first? Take a tour of SmartSize size charts , or read the full Shopify size chart builder feature guide .
Questions? Reach out at [email protected] .
— Helen, SmartSize support